History - Salesforce charting background
Since it's launch in 1999, Salesforce used a third party charting technology to power all visualization. In 2013 a team in Salesforce Analytics Cloud re-wrote their charting library from scratch. This charting library was implemented in JavaScript which renders in HTML5 Canvas. I was the first designer on this team and since then we have shipped over 30 different customizable charts over the last four years.
- Team: Myself, Product Manager, 4 Developers & User Researcher
- My Role: Desginer
- Collaboration: All teams in analytics cloud and other salesforce platforms that used charts
- Time: 4+ years
Dreamforce'15 Lightning Launch
The first version of the new charting platform which was known as EclairNG (our lead architect is french and loves eclairs, hence the name ;) ) was launched at Dreamforce 2015 when Lightning was announced. New charting platform was part of the Lightning announcement where users could get a more modern looking and performant charting library.
Parity with old charting technology
Our goal for v1 was to build charts that would get us parity with the old charting platform. We started with simple charts like bars, lines, donut and funnel. Our goal was to have our existing users easily switch to lightning and use the new the platform. While working on parity, I also worked with the product manager and researchers to do a competitive analysis of charts built by charting platforms like Google Charts, D3 and High Charts and other analytic tools like Tableau.
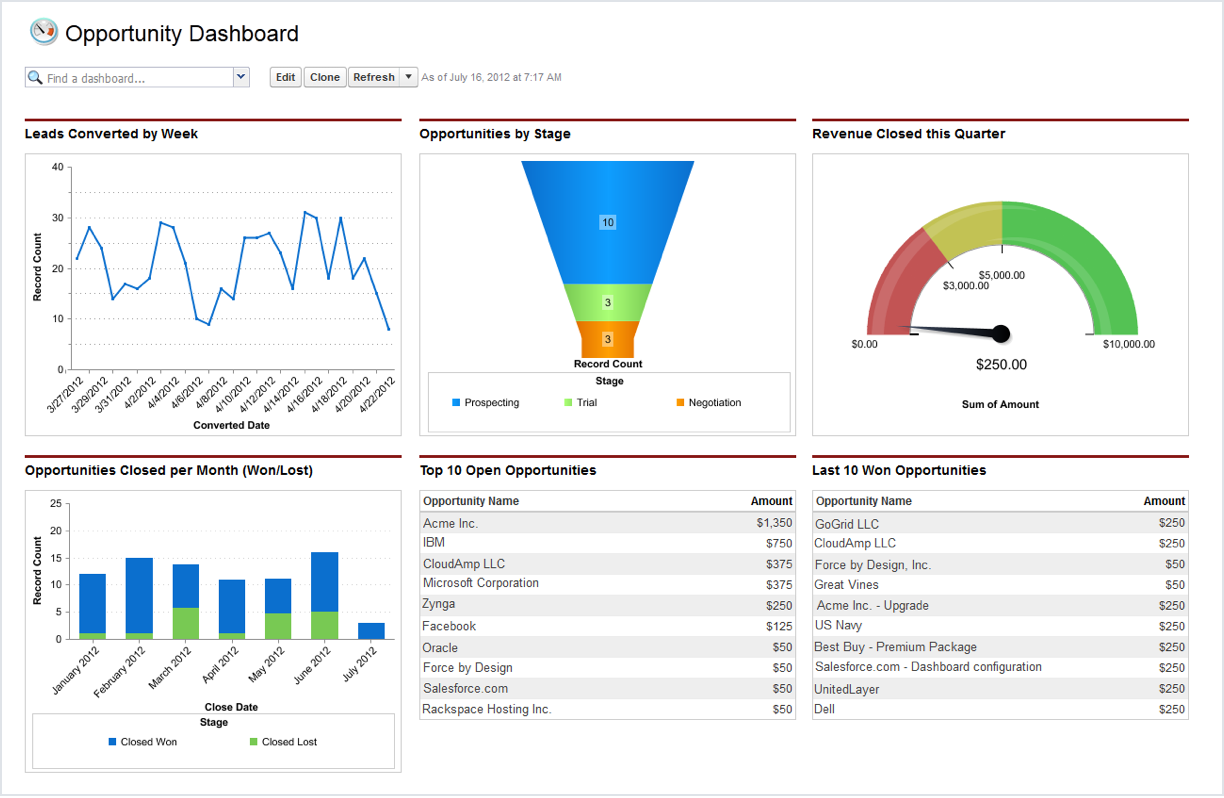
Old charts built in late 90's
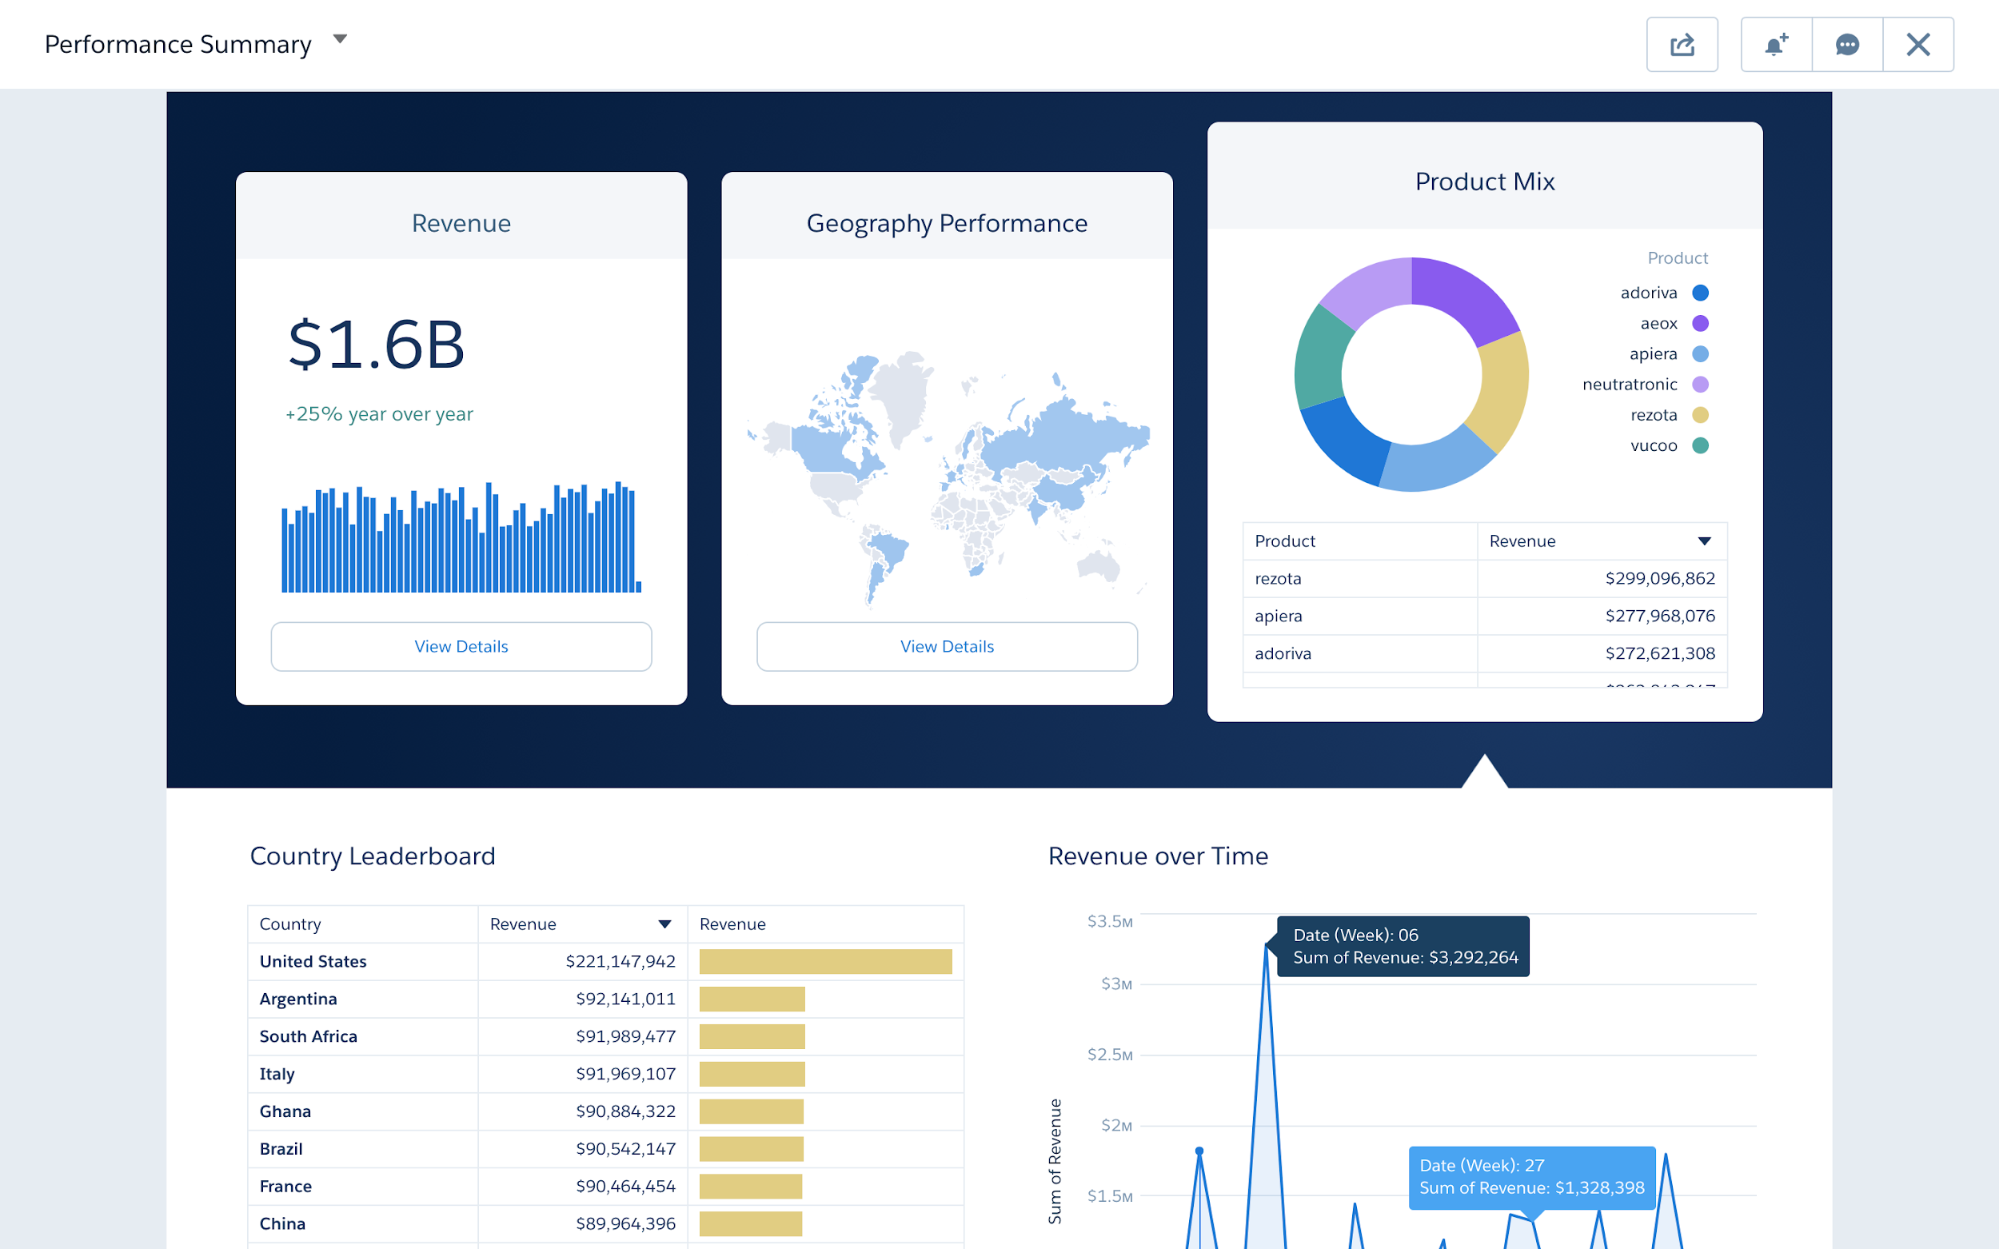
New salesforce charts
Feedback from users
When we launched our new charting platform, we got a lot of positive feedback on the look and feel of our charts and the fact that they had rich interactions like filtering and faceting. But we also got a lot of feedback from customers who were used to seeing dense information on their screens. They said that wanted to view more information in the available real estate. Our charts were also not responsive, which led to a lot of white space when they were used to represent real data on dashboards.
Charts didn't scale, which led to a lot of whitespace in pages they were used
Continuing to improve the platform
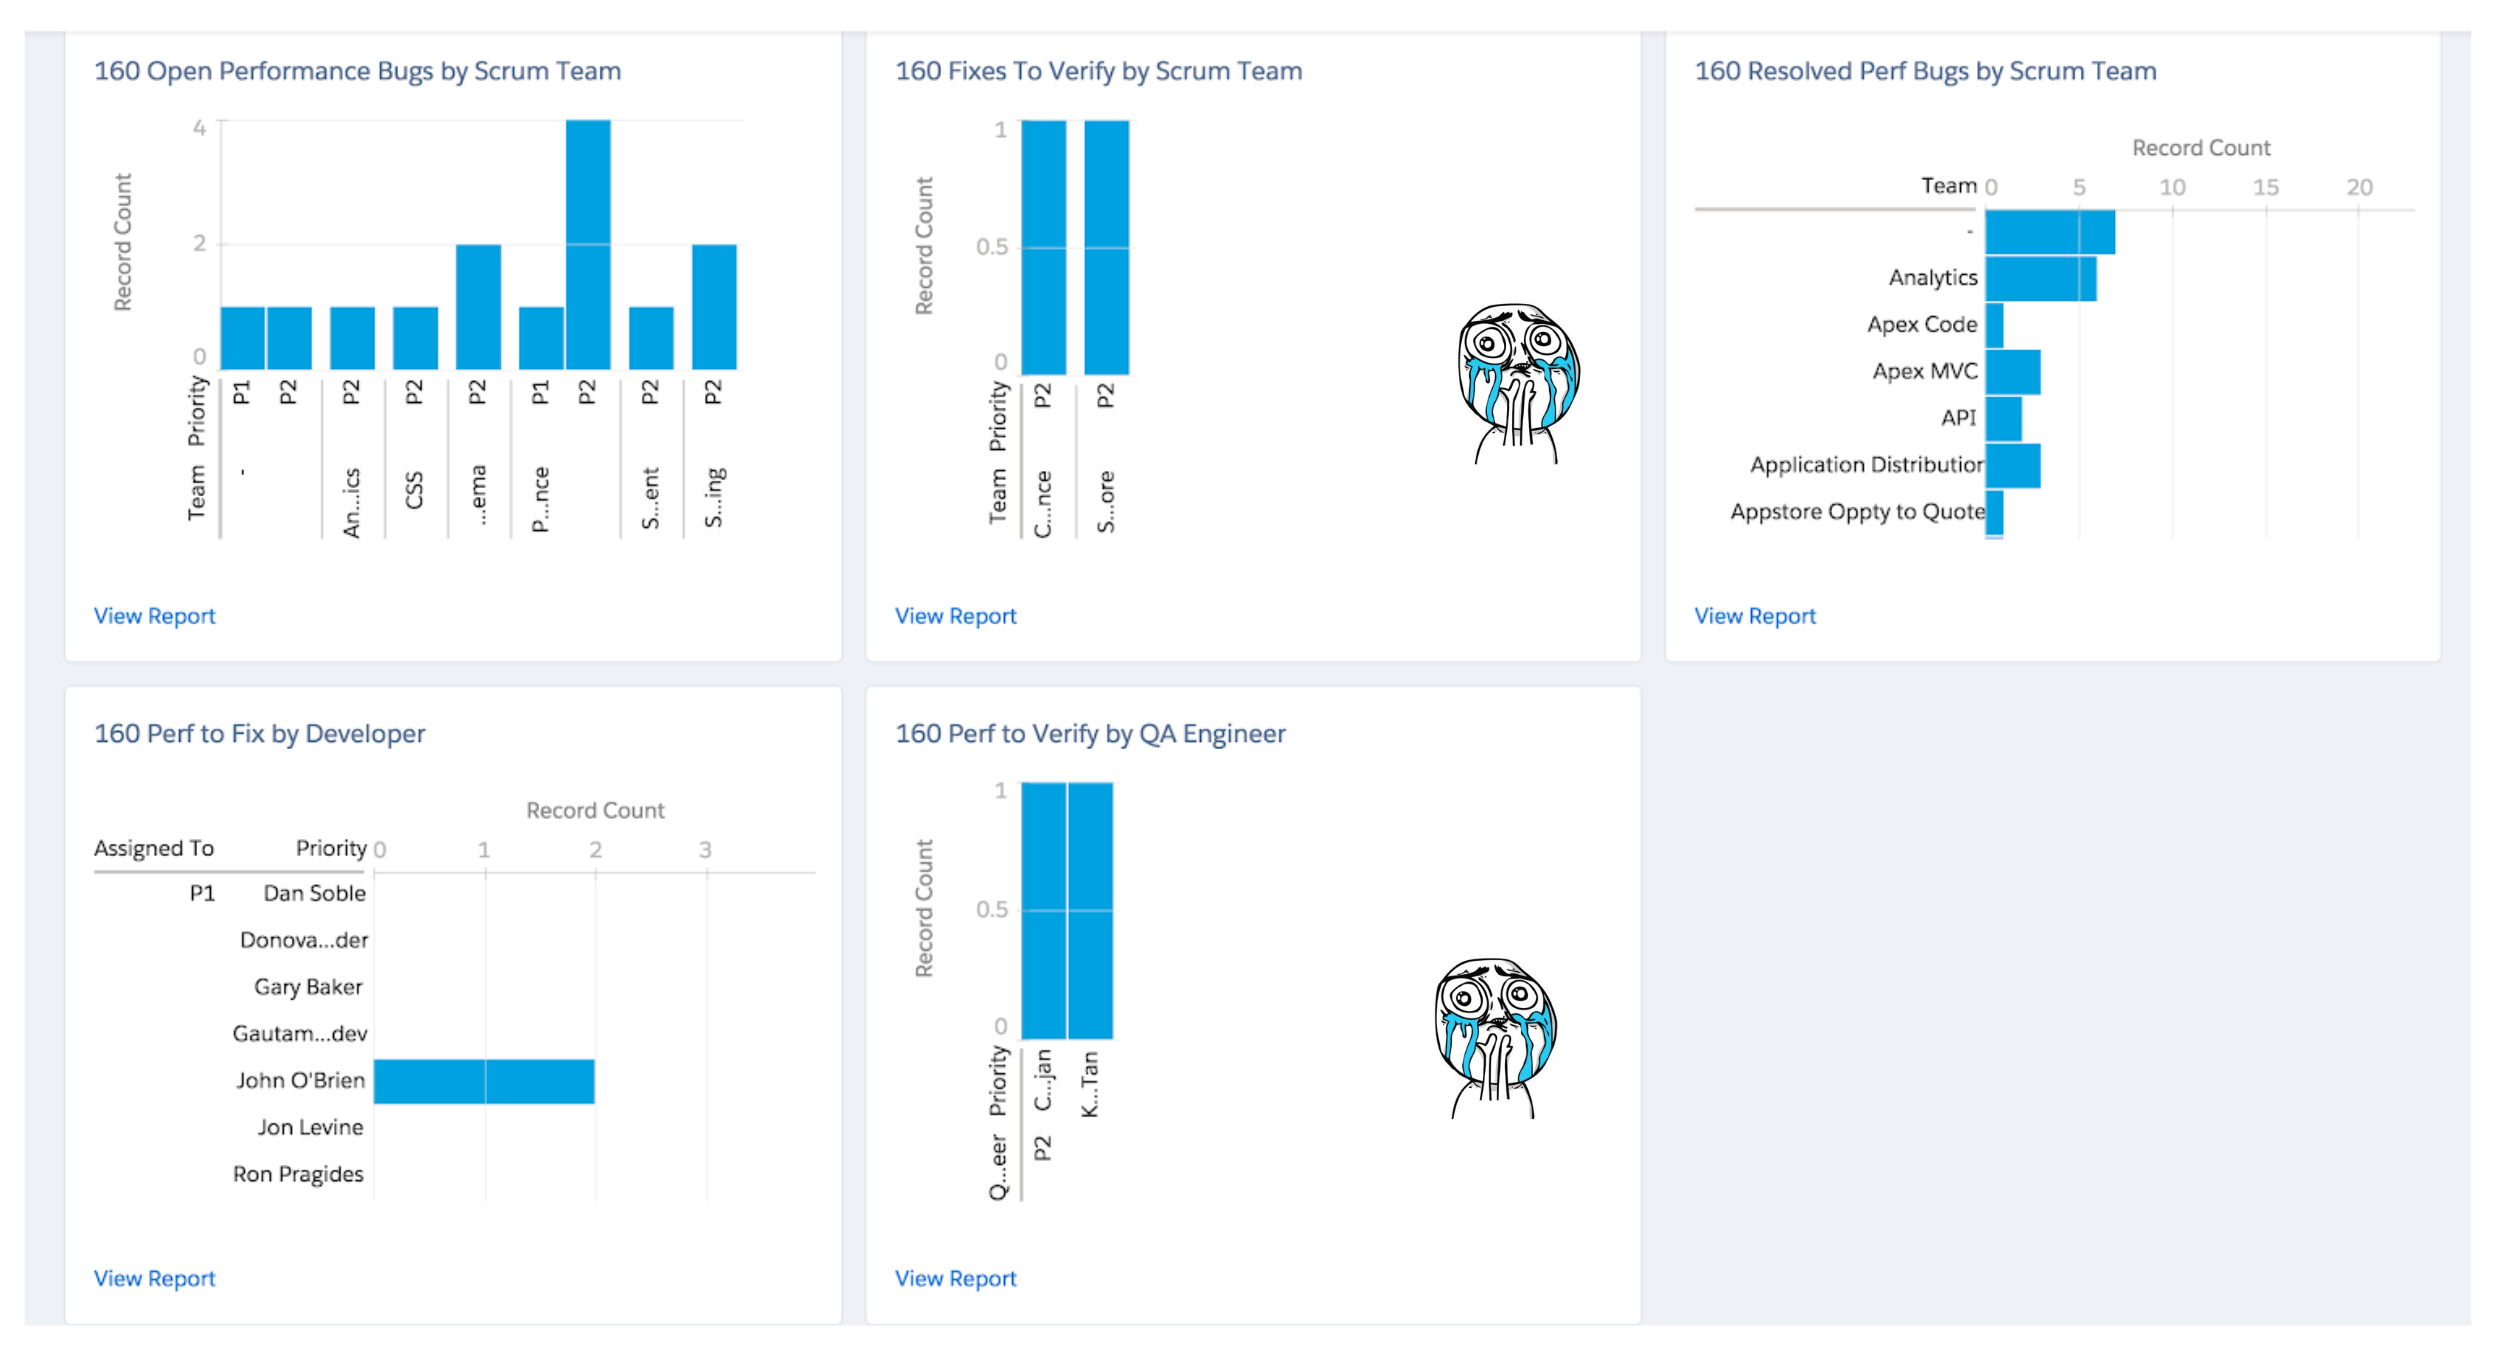
For the next few of releases, we continued to make the platform better based on user feedback. We shipped new charts like scatter plot, maps, and other advanced charts. Some of the additonal fratures we worked on were:
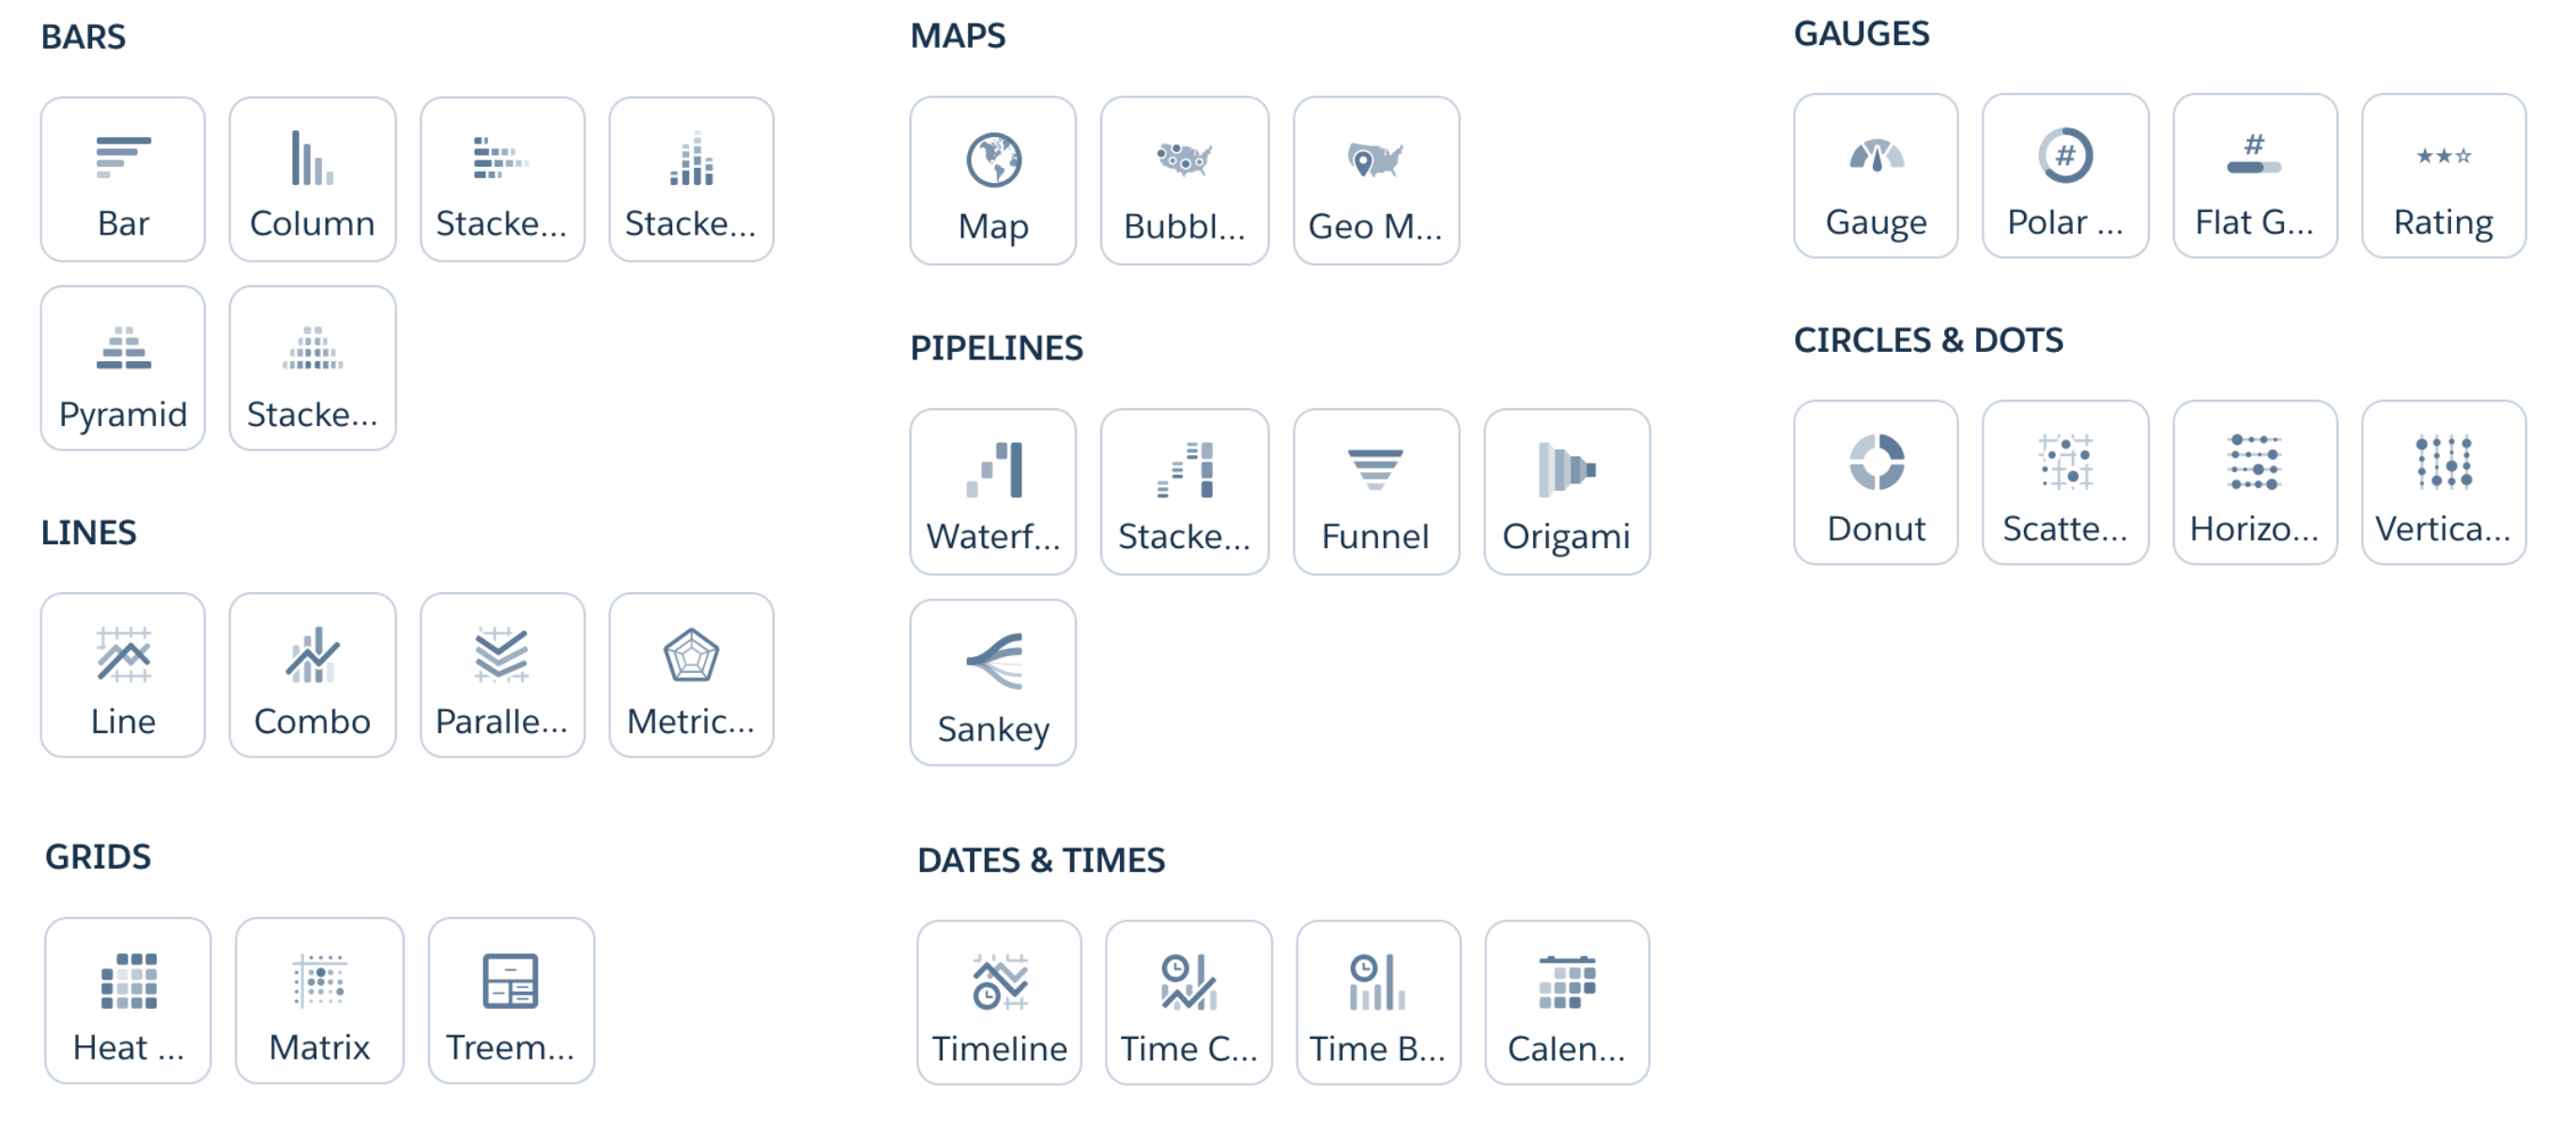
Salesforce charting library has more than 30 charts
Responsiveness and fluidity
We worked on making our charts responsive to all screen sizes. We also added algorithms to make chart labels smart, so that they could adjust based on available space. When we shipped responsive charts next release, we got a ton of positive feedback from users and other platforms who were using our charts. Some of these interactions were introduced in a charting platform for the first time and we got design patents for it.
Charts can scale and are responsive to the data and real estate available on screen
Each shape in the chart morphs to create an animation that makes it easy to read and fun to view
Customizing charts
Since our charts were used for different use cases, we got a ton of requests from users about properties that they'd like to edit. Every user had a different property they wanted to customize based on their use case. Our data query tool and dashboard builder where users mostly build charts had a property panel to pick the chart type, so we started working on exposing properties that user could customize for their chart. Since the last four years, we have worked on more than 100 different customizable properities, so that user can edit and make their charts fit their specific use case.
User can customize more than 100 different visual properties
Picking the right color palette
Along with properties, users also want to customize chart palette to match their branding. I worked with our research team and creative director to come up with more than 12 different color palettes. The research team did a color survey to understand how users react to colors.
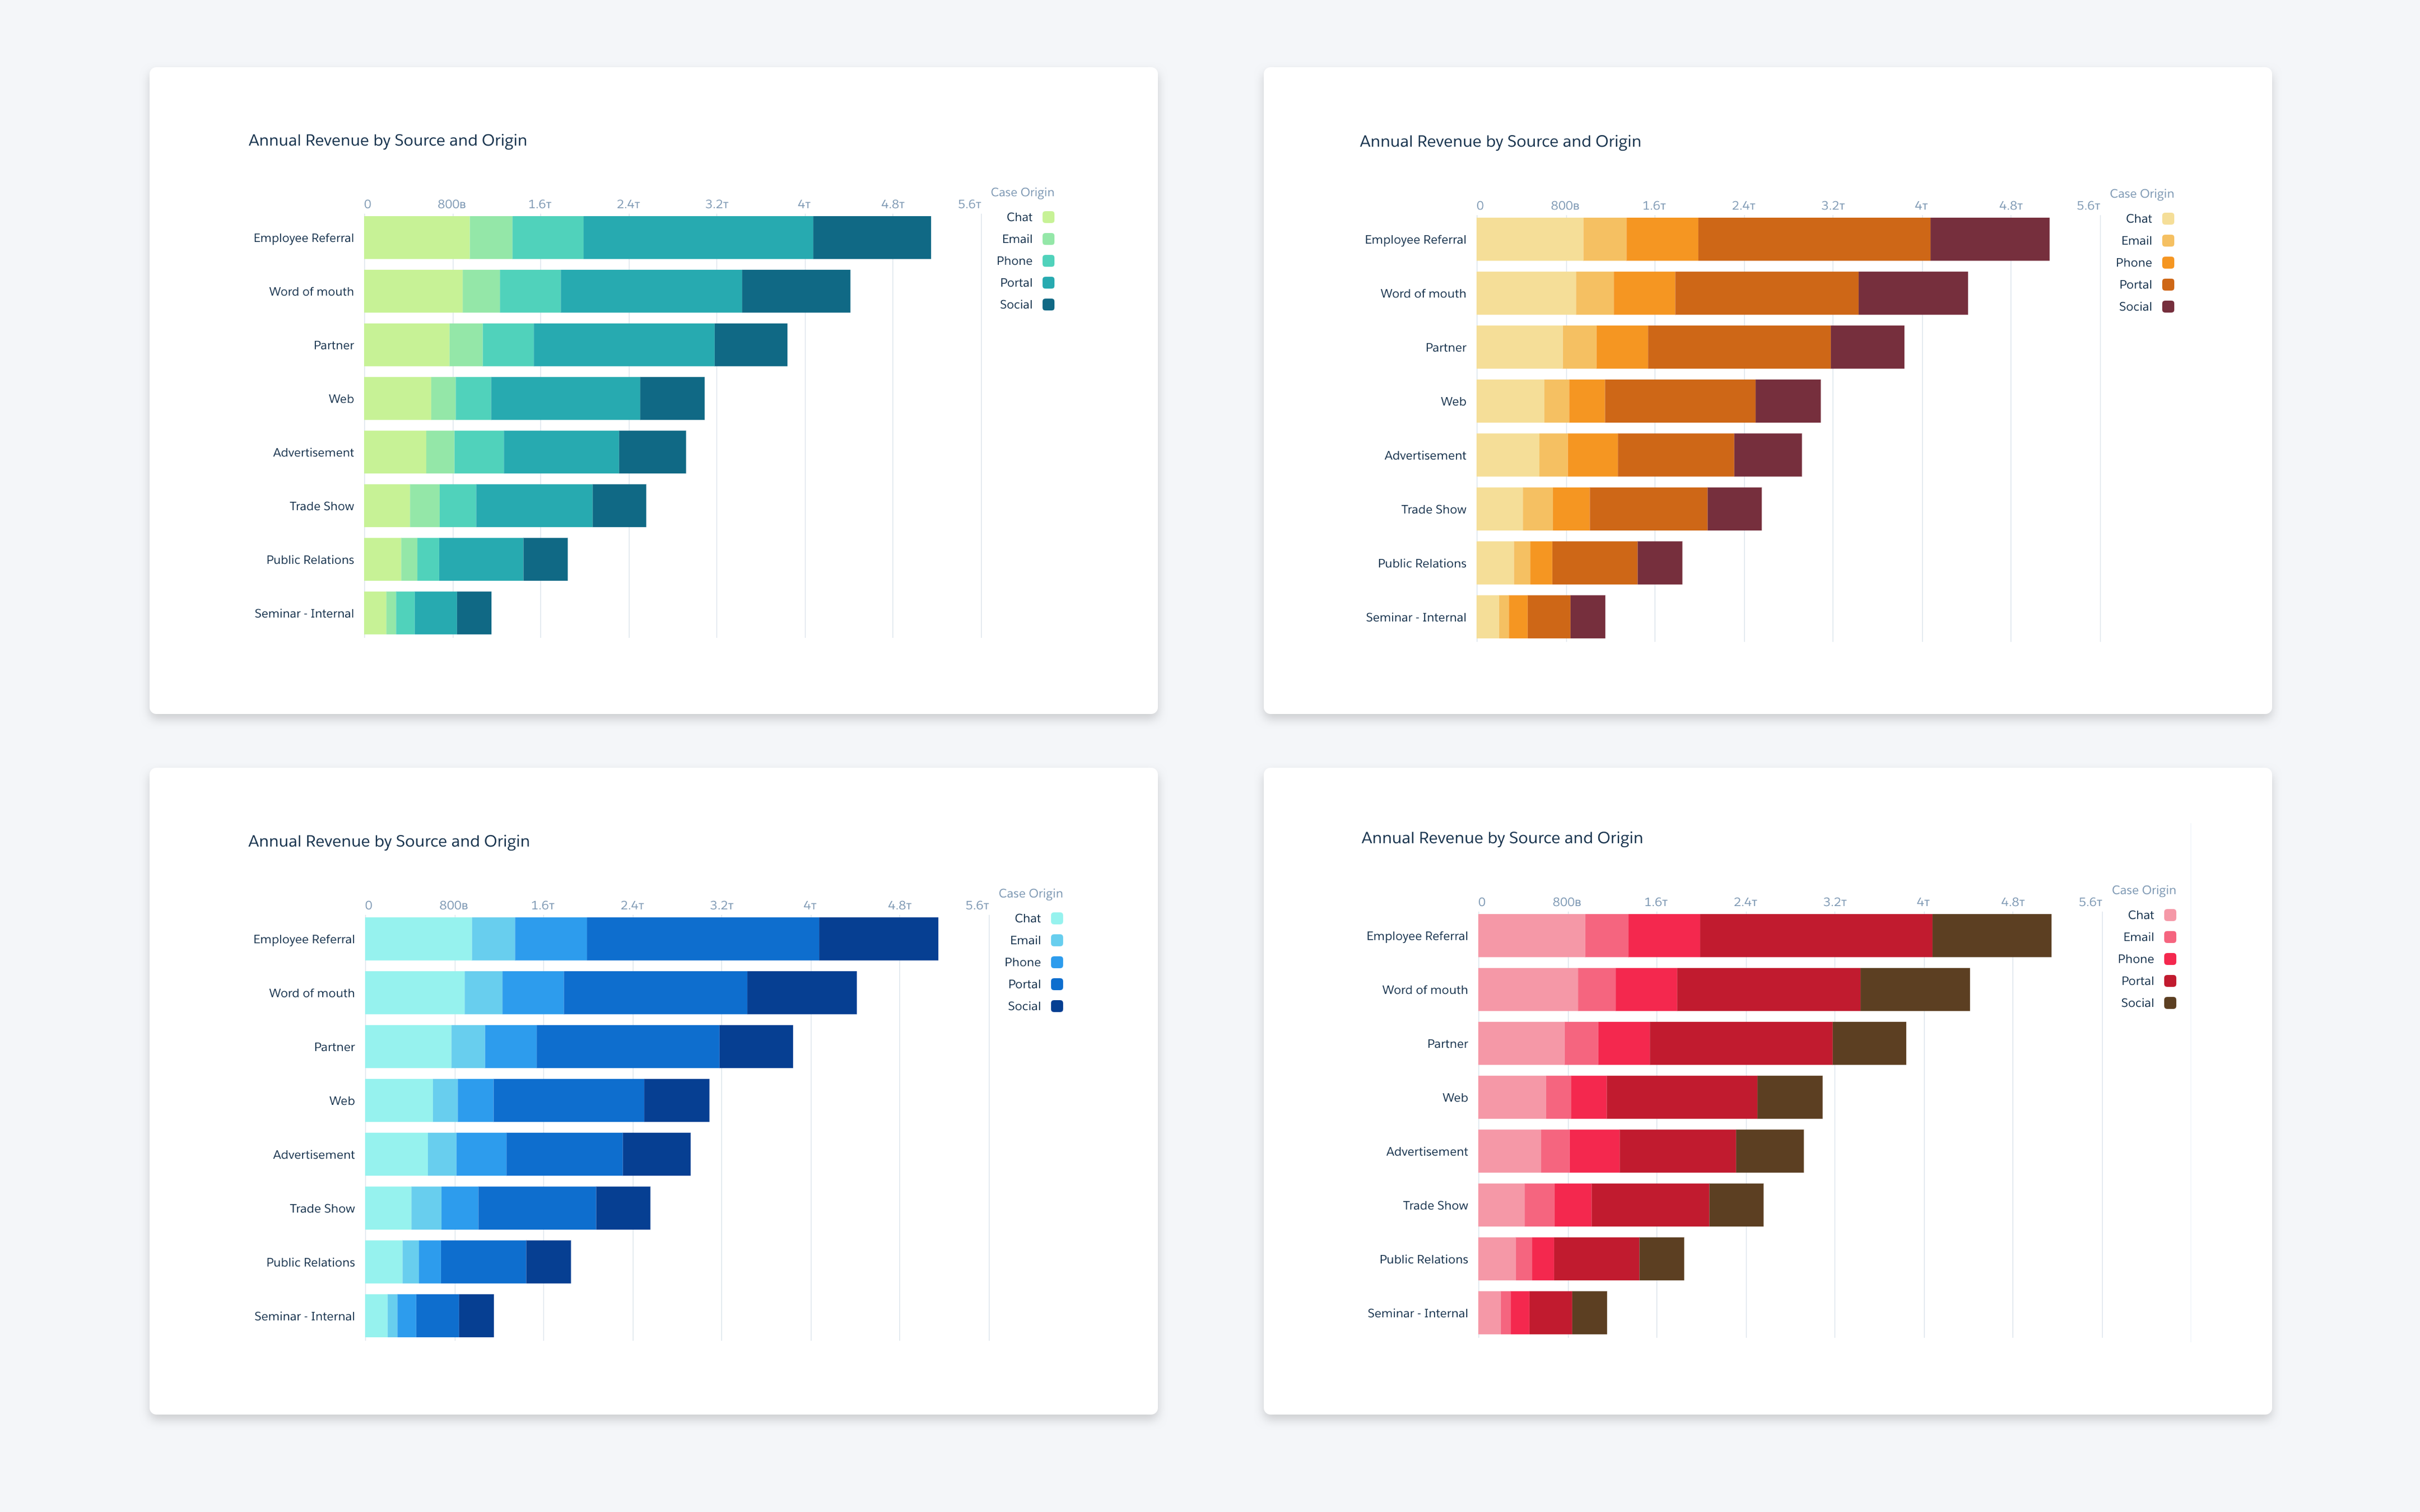
Chart themes to be used on a light background
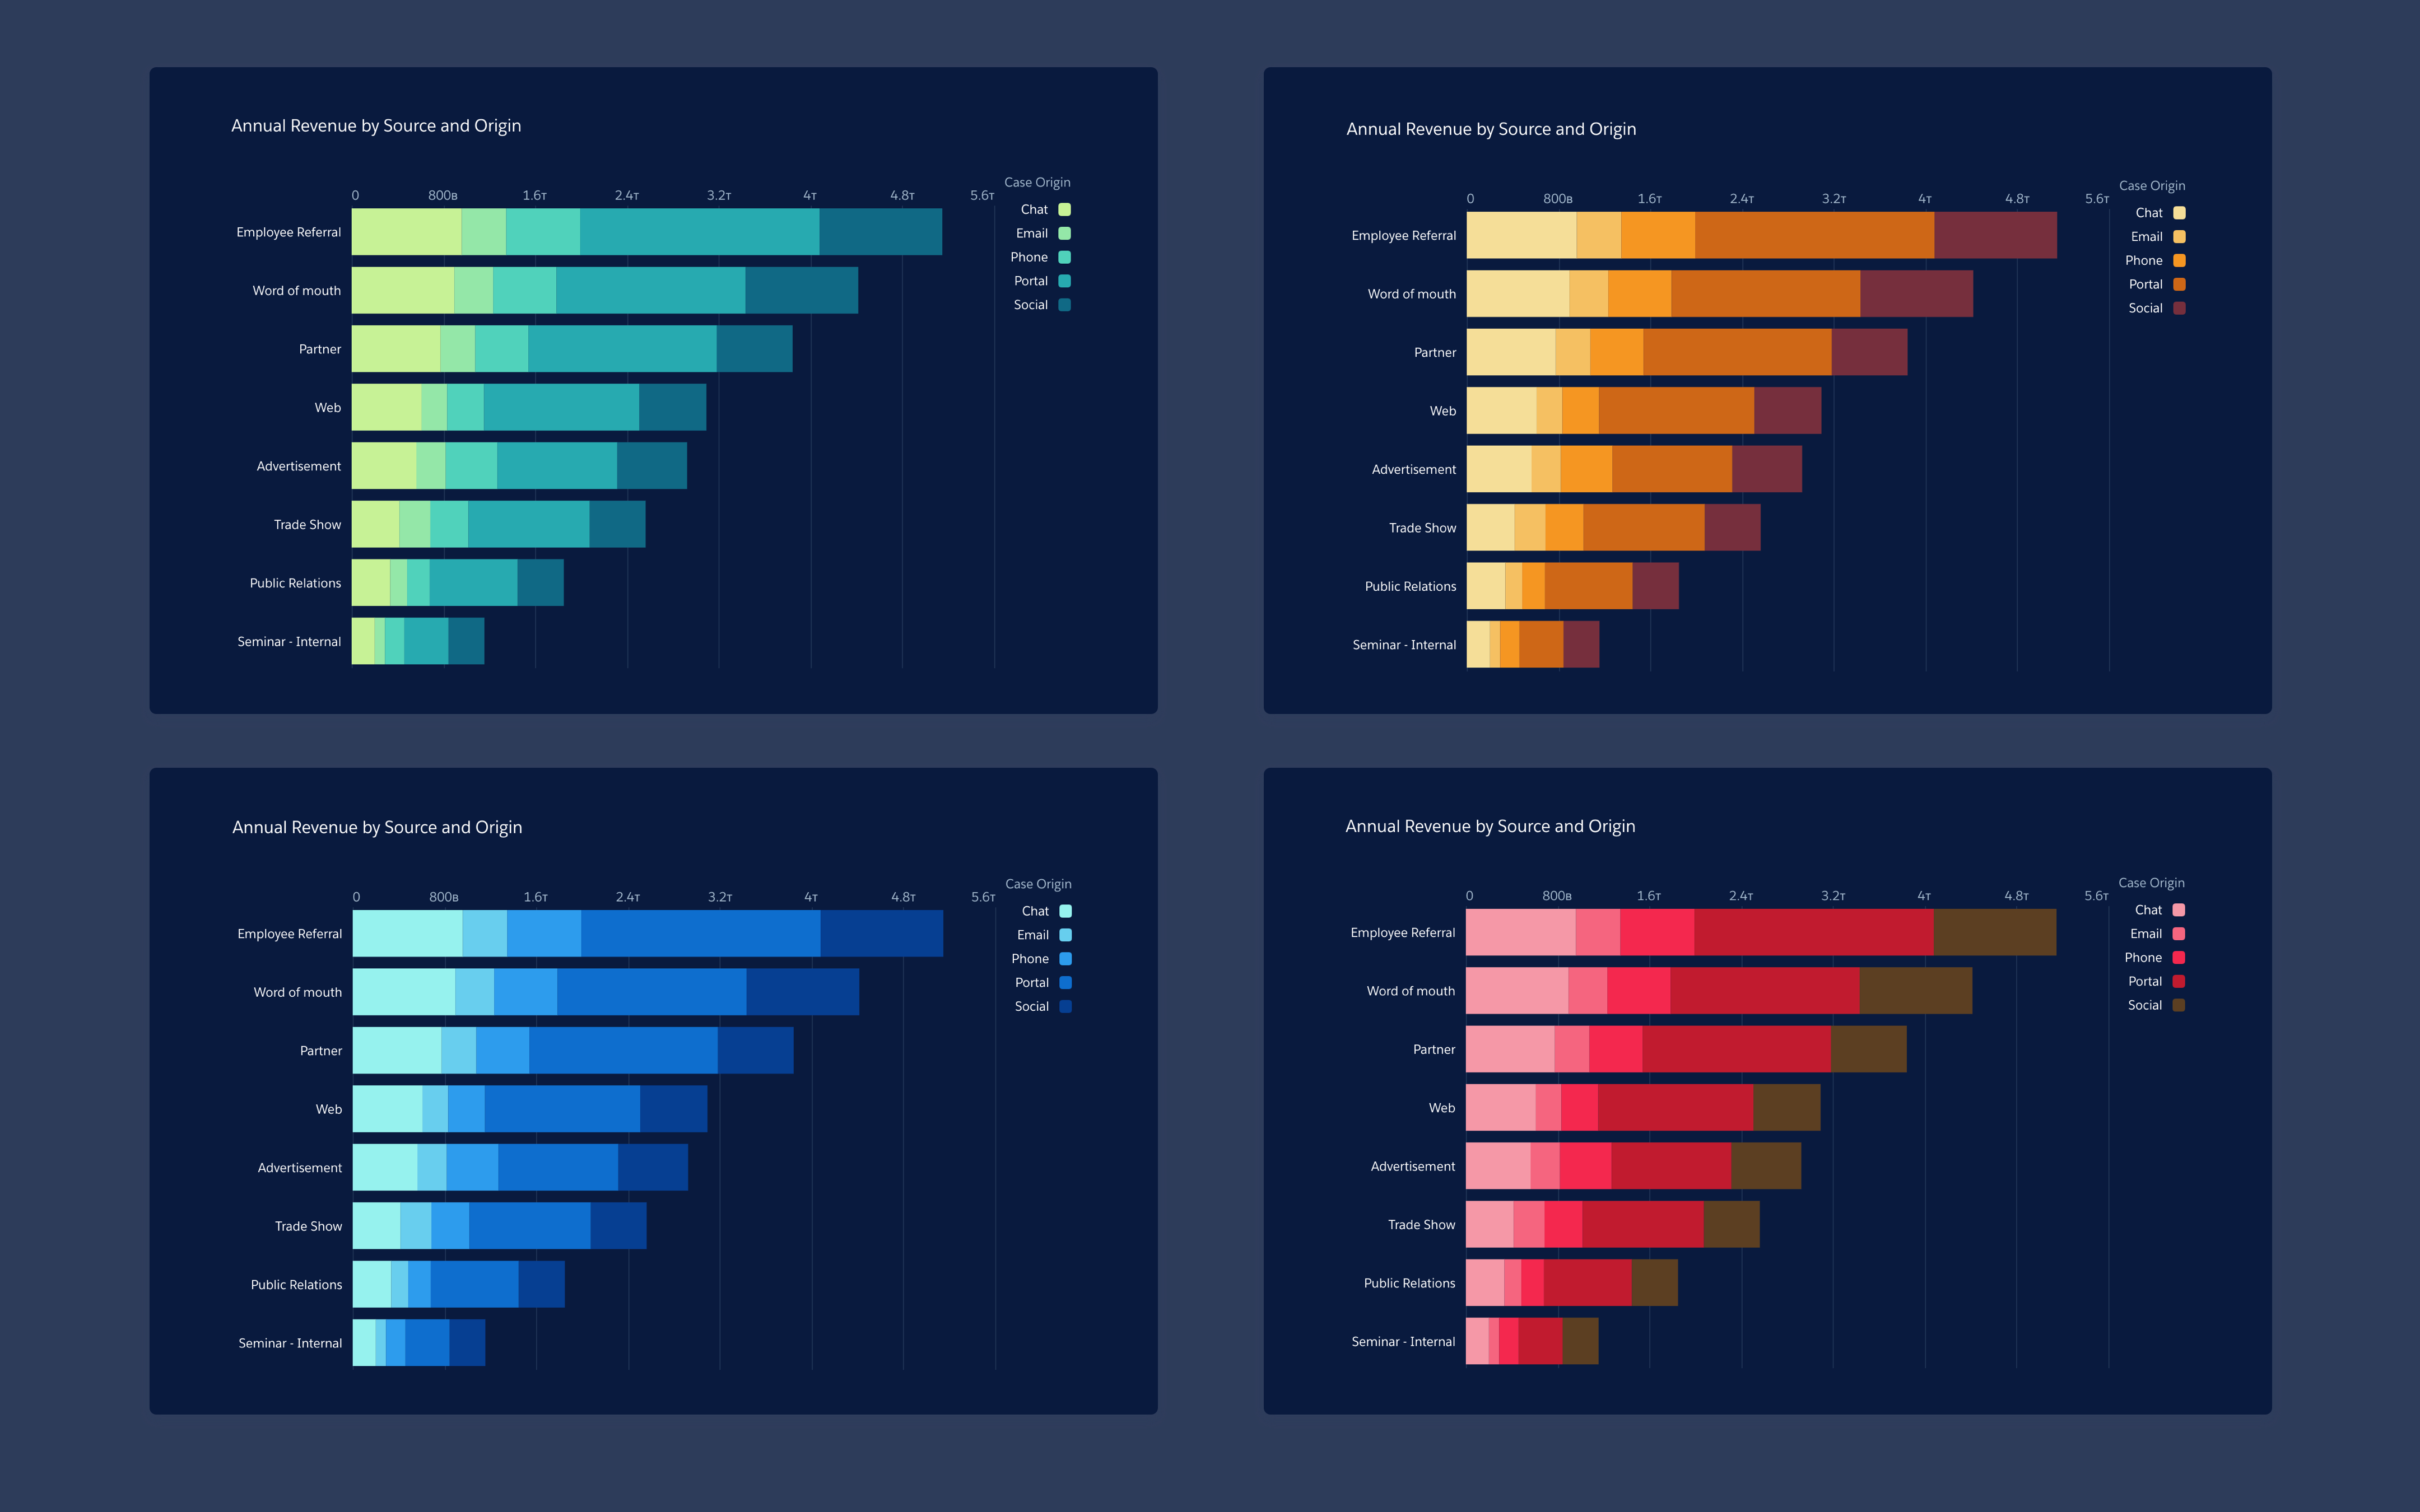
Chart themes to be used on a light background
A playground for team collaboration
A couple of developers built a playground environment during a hackthon. This playground is like a WISWYG tool where designers and product manager can go in and edit chart properties. This playground was a huge help for me as a protoyping tool. I could go into the playground and do some quick edit and verify concepts and designs.
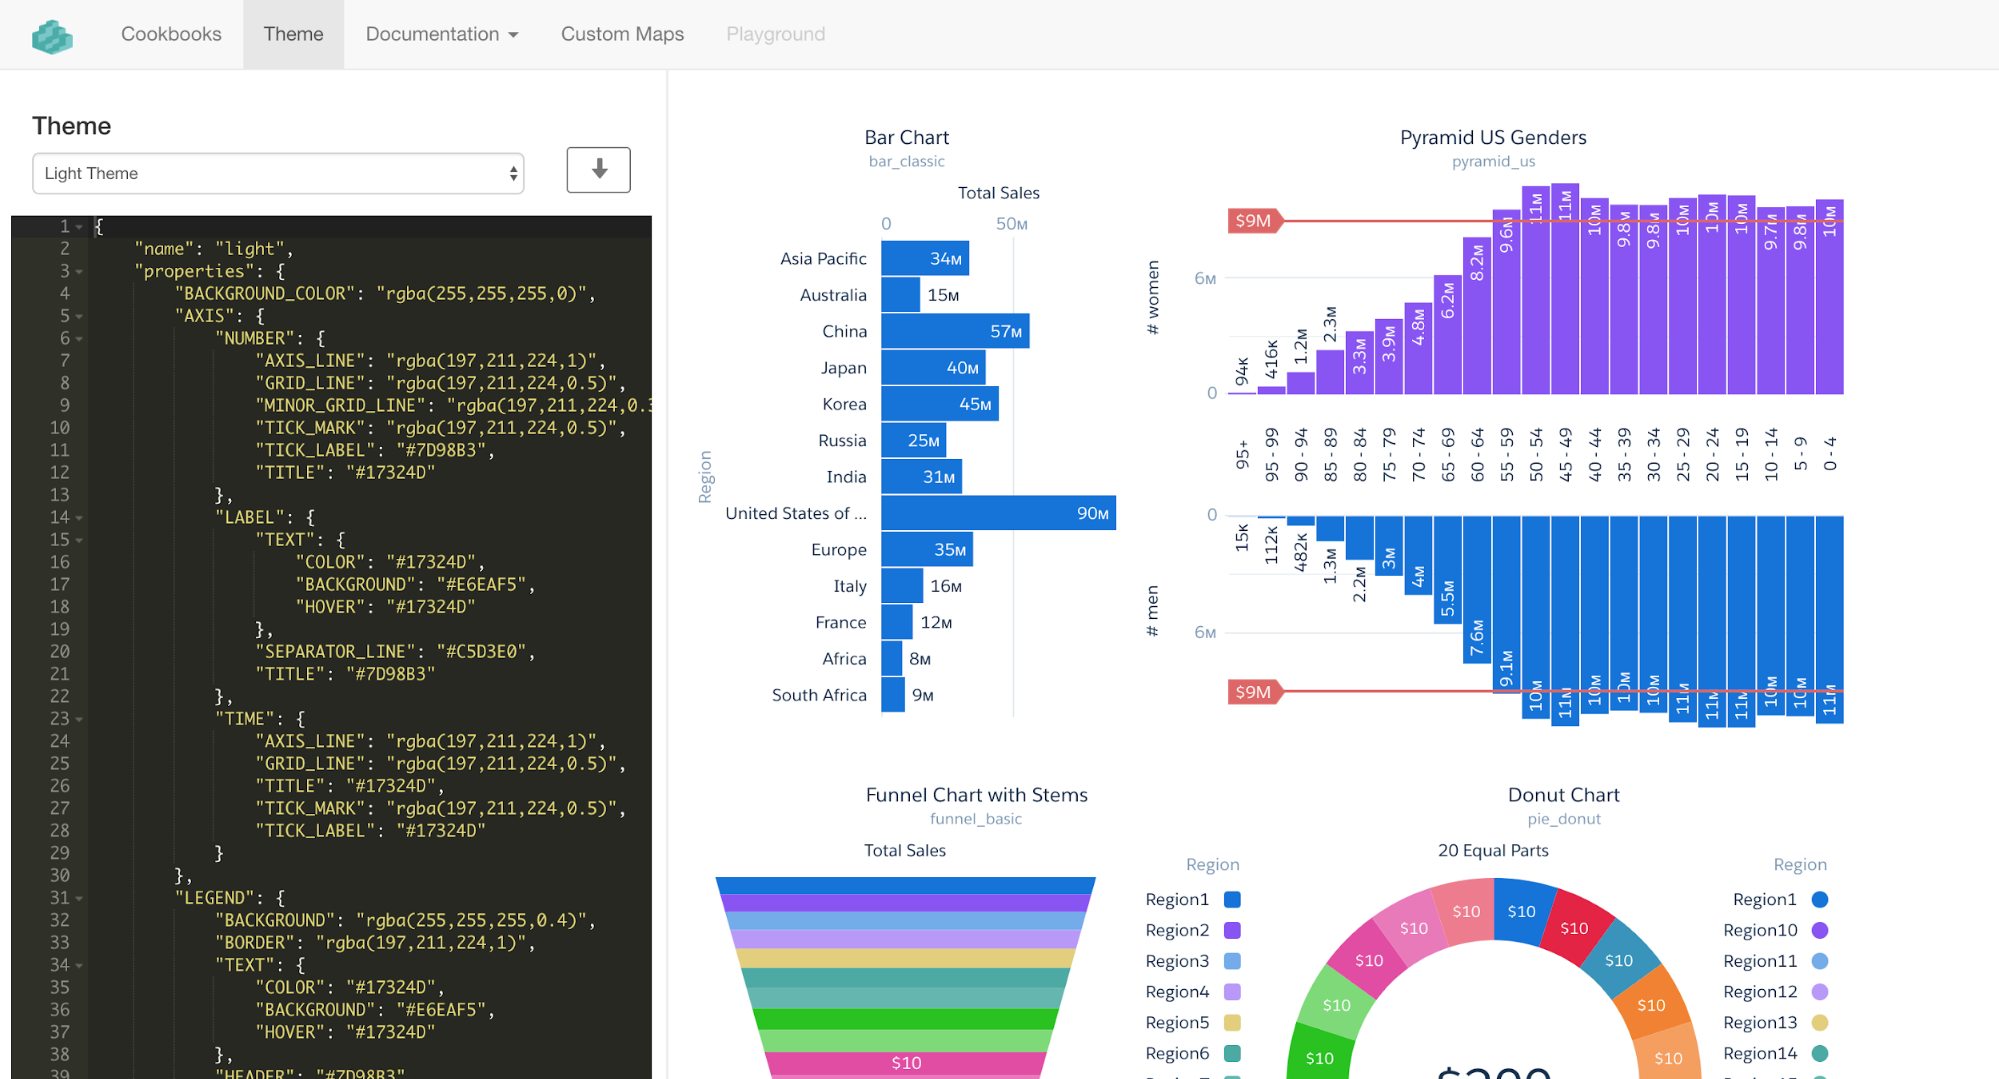
Playground for designer and developer to collaborate
Building a design system for charts
Since our charting platform has matured, it's being adopted within various teams at Salesforce. Being the only designer on this team I get a lot of questions about charting best practices, sketch kit and what type of chart to use for a specific use case. For the past one month, I have been working with the Salesforce Lightnign Design Team a chartung section in our design system, so that other designers and stakeholders in Salesforce and our customer can learn more about data vizualizations.
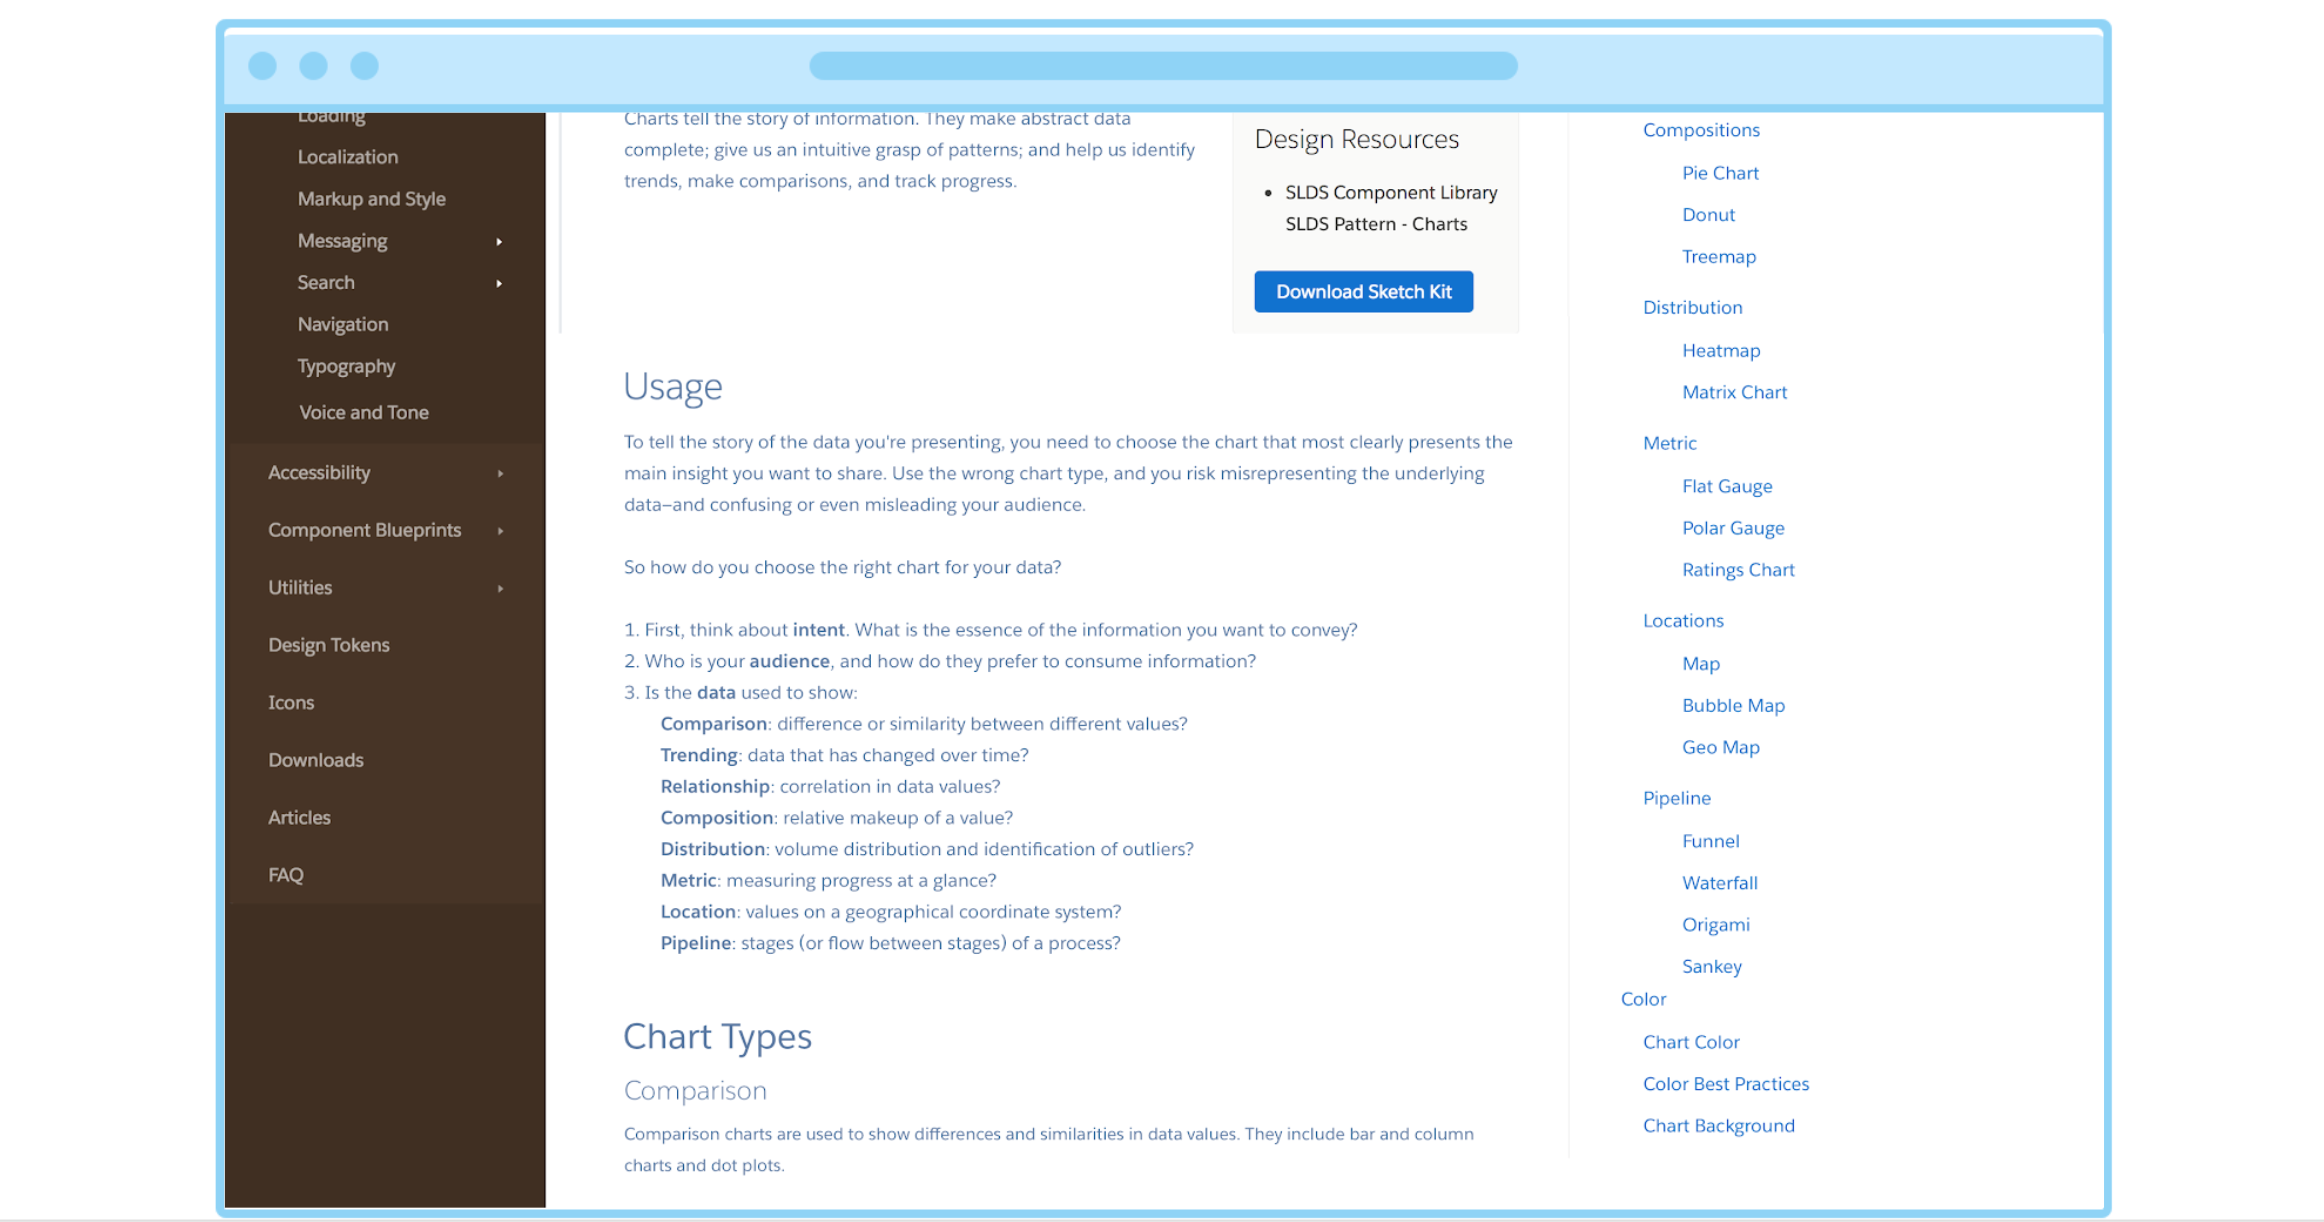
Design system mock up for picking the right chart
Design system mock up to understand a chart usage
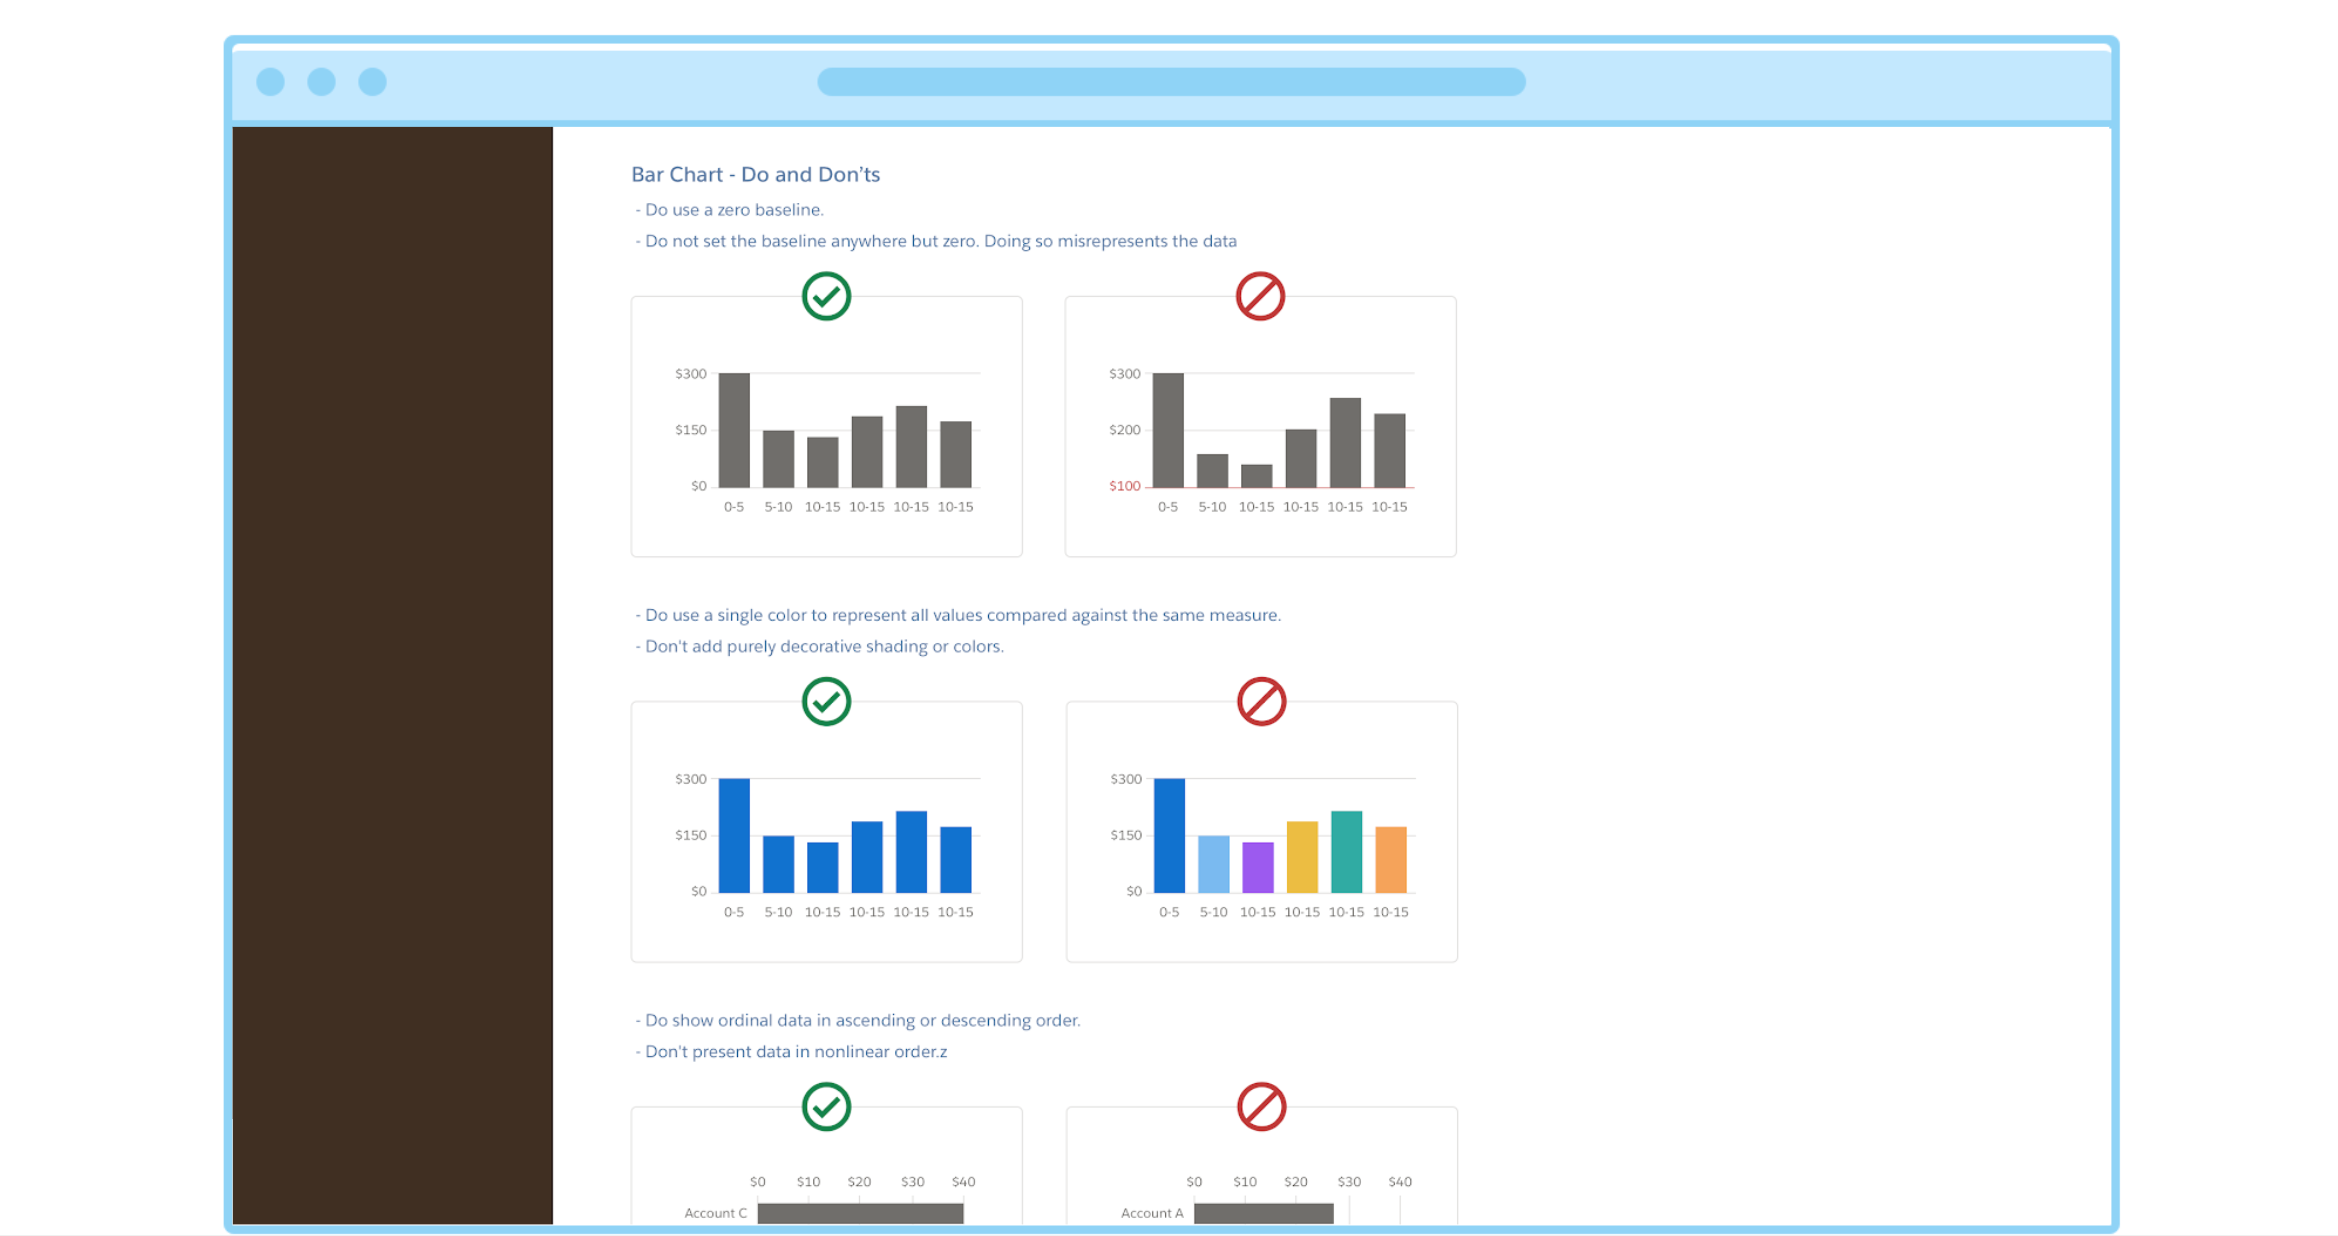
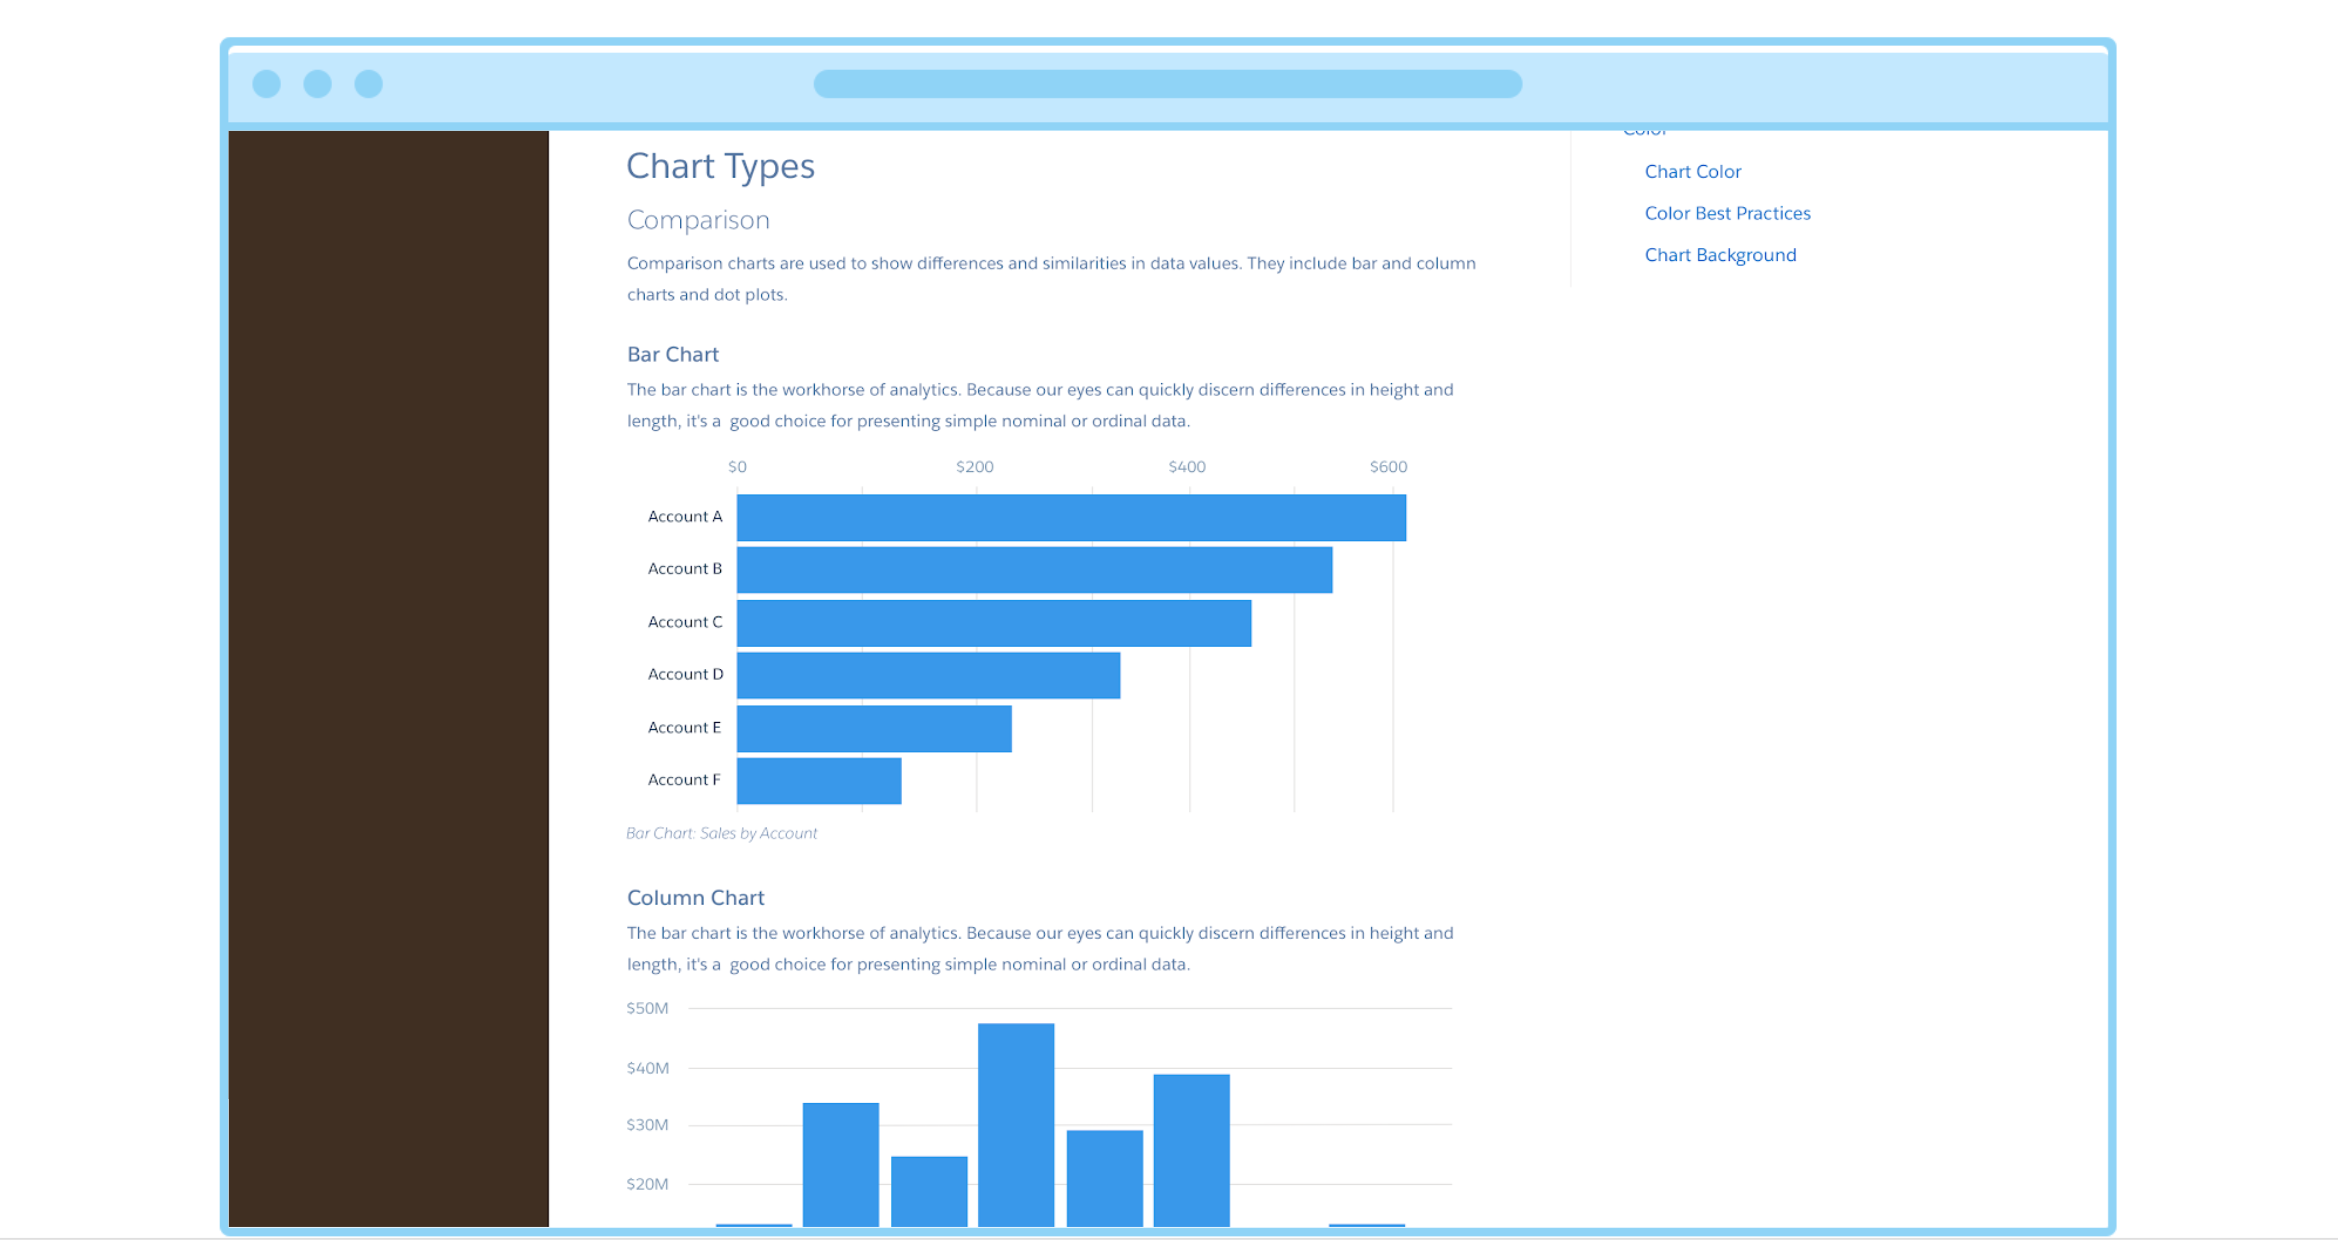
Design system mock up to learn chart best practices
Chart's Future
While we have accomplished a lot in the last four years, there is still a lot to improve and add on. Going forward, I'd like to work on richer interaction in charts so that user can interact with charts to get more information about their data. We have been working on future looking designs to layer additonal information on charts so that user can hover n data points and get recommendations, insights and additonal information about that specific data. We have also been exploring ways for users to add their own custom theme to make charts match their branding.
I am very grateful to have worked with this team and am proud of what we have accomplished so far. Special thanks to Alice Chen and Didier Phrophete, who were the first two engineers on this team and I learnt so much from them.